Real-time analysis of streaming audio data with Web Audio API
Web Audio API is a high-level JavaScript API for processing and synthesizing audio in web applications. The aim of the API is to enable things like dynamic sound effects in games, sound processing in music production applications, and real-time analysis in music visualisers.
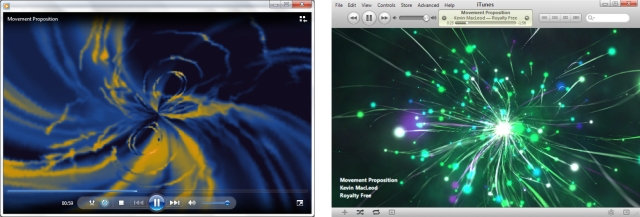
Music visualisers create and render animations synchronised to changes in the music’s properties (frequency, loudness, etc). Most media players (such as Windows Media Player, or iTunes) have some sort of music visualiser feature…

Creating this type of visualisation in the browser was only really practical by pre-processing the audio up-front and storing information separately to be accessed by the visualiser during playback. But that was before the Web Audio API and its real-time analysis capabilities…
The API is currently a working draft so things can change at any time. However, there is partial support in Chrome (as long as we use a webkit prefix),[1] which means we can start to have a play around and investigate its features. In this post we’ll begin to investigate the real-time analysis capabilities of the API. (Obviously, there’s a whole lot more to the API that we won’t even touch on here!)
If you’ve got a supported browser you should be able to see it in action here with a very basic music visualizer that runs in the browser without the restriction of having to pre-process each piece of music in advance.
Music: Movement Proposition, Kevin MacLeod (incompetech.com)
Unable to run this Web Audio API example. Check browser support

The rest of this post will introduce some of the basic concepts of the Web Audio API and outline the implementation of the above animation. If you prefer, just dive straight in to the source code here.
Audio routing graphs
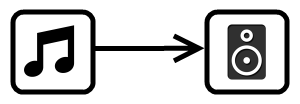
The API is based around the concept of audio routing graphs. At its simplest, an audio routing graph will consist of a single sound source (such as the audio data in an MP3 file) connected directly to a sound destination (such as your computer’s speakers).

In general, the routing can contain any number of ‘nodes’ connected between one or more sound sources and ultimately connecting to the destination (what you get to hear). Audio data is passed in to each of the nodes, manipulated in some way and output to the next connection.
Using the API basically comes down to creating different types of nodes (some for controlling various properties of the audio, some for adding effects, etc, etc) and defining how the nodes should be connected together. As you can imagine, this can allow much more complex and powerful routing than the simple connection shown above. The routing we’ll be using to access the real-time analysis of the audio is very straightforward though, as you’ll see later.
The AudioContext
The AudioContext object is the main abstraction used for creating sound sources, creating the audio manipulation nodes, and defining the connections between them.
var context = new webkitAudioContext();
  // (Remember the 'webkit' prefix we mentioned earlier?)
So, let’s see how we could use this to create that simple source-to-destination routing we showed earlier.
First, we need the sound source. One way to create a sound source is to load the audio from an MP3 file into memory using an XMLHttpRequest. In the code below we’ve used the AudioContext’s createBufferSource to create the source node. Then we use the context’s createBuffer function to convert the ArrayBuffer response from the request into an AudioBuffer, and use that to set the source’s buffer property…
var request = new XMLHttpRequest();
request.open("GET", urlToMp3File, true);
request.responseType = "arraybuffer";

request.onload = function() {
    var source = context.createBufferSource();
    source.buffer = context.createBuffer(request.response, false);
}

request.send();
We don’t have to create the destination node. The AudioContext has a destination property which represents the final destination to the audio hardware. We simply create the routing by connecting our source object to the AudioContext’s destination.
source.connect(context.destination);
A streaming sound source
The buffer approach described above is fine for short audio clips, but for longer sounds we wouldn’t want to wait for the full data to be loaded into memory! It is, however, really easy to get streaming audio input as a sound source in an audio routing graph. To do this we use an <audio> HTML element…
<audio id="player" src="urlToMp3"></audio>The <audio> element represents an audio stream. The AudioContext has a function, createMediaElementSource, which creates a sound source node that will re-route the element’s audio playback and stream it through the routing graph…
var audioElement = document.getElementById("player");
var source = context.createMediaElementSource(audioElement);
source.connect(context.destination);
One ‘gotcha’ that you may need to be aware of (depending on the status of issue 112368), is that the source and its connection may need to be created after the audio element is ready to play…
audioElement.addEventListener("canplay", function() {
    var source = context.createMediaElementSource(audioElement);
    source.connect(context.destination);
});
The AnalyserNode
So, now we have our streaming input coming into our routing graph and going straight to our audio hardware. But, how do we do the real-time analysis in order to make our music visualiser? Well I did say that the routing was really simple, so here it is…

The API provides a node that does it all for us - the AnalyserNode. All we need to do is create an AnalyserNode and stick it in the routing graph between our source and destination. When the AnalyserNode is used in a routing graph, the audio data is passed un-processed from input to output, but we can use the node object to access the frequency-domain and time-domain analysis data in real-time.
As you’d expect, an AnalyserNode can be created using the createAnalyser function on the AudioContext object…
var analyser = context.createAnalyser();And, to create the routing graph we simply insert the analyser between our streaming audio source and the destination…
audioElement.addEventListener("canplay", function() {
    var source = context.createMediaElementSource(audioElement);

    // Connect the output of the source to the input of the analyser
    source.connect(analyser);

    // Connect the output of the analyser to the destination
    analyser.connect(context.destination);
});
By default the analyser will give us frequency data with 1024 data points. We can change this by setting the fftSize property. The fftSize must be set to a power of two[2] and the number of data points in the resulting frequency analysis will always be fftSize/2. The frequencyBinCount property of the analyser will tell us the number of data points we’re going to get in the frequency data.
console.log(analyser.fftSize); // 2048 by default
console.log(analyser.frequencyBinCount); // will give us 1024 data points

analyser.fftSize = 64;
console.log(analyser.frequencyBinCount); // fftSize/2 = 32 data points
So, if we keep a byte array with frequencyBinCount elements, we can populate it with the frequency data at any time by passing it to the analyser’s getByteFrequencyData[3] function…
var frequencyData = new Uint8Array(analyser.frequencyBinCount);
analyser.getByteFrequencyData(frequencyData);
Creating the animation
The best way to use this real-time data to create and render an animation is to refresh our frequencyData in a requestAnimationFrame callback, and then use the new data to update the animation. requestAnimationFrame just schedules the function to be called again at the next appropriate time for an animation frame. It allows the browser to synchronize the animation updates with the redrawing of the screen (and possibly make some other optimisations based on CPU load, whether the page is currently in a background or foreground tab, etc).
function update() {
    // Schedule the next update
    requestAnimationFrame(update);

    // Get the new frequency data
    analyser.getByteFrequencyData(frequencyData);

    // Update the visualisation
    bars.each(function (index, bar) {
        bar.style.height = frequencyData[index] + 'px';
    });
};

// Kick it off...
update();
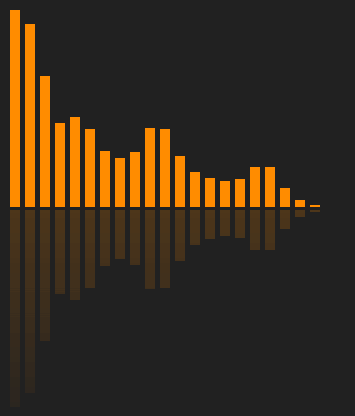
Here we’re simply using the frequency data to set the heights of some coloured ‘bars’. (The ‘bars’ are divs laid out horizontally with a fixed width and a dark orange background-colour.) Of course, just displaying the frequency data in a bar graph is the simplest (and least entertaining!) music visualisation but with a bit more imagination and creativity it should be possible to use this approach to create some much more interesting music visualisations.
Don’t forget to look through the final source code for our simple example.
1. FireFox has an alternative API which has been deprecated in favour of supporting the Web Audio API in the future.
2. I think the power of 2 restriction just allows it to use a more efficient FFT algorithm...but I've forgotten much of my signal processing studies now so don't quote me on that!
3. There is also a getByteTimeDomainData function for getting the current time-domain (waveform) data but our simple animation only uses the frequency data.
comments powered by Disqus
About
I work as a Software Developer at Nonlinear Dynamics Limited, a developer of proteomics and metabolomics software.
My day job mainly involves developing Windows desktop applications with C# .NET.
My hobby/spare-time development tends to focus on playing around with some different technologies (which, at the minute seems to be web application development with JavaScript).
It’s this hobby/spare-time development that you’re most likely to read about here.
Ian Reah
